
Push Notification Data
Push Data Overview
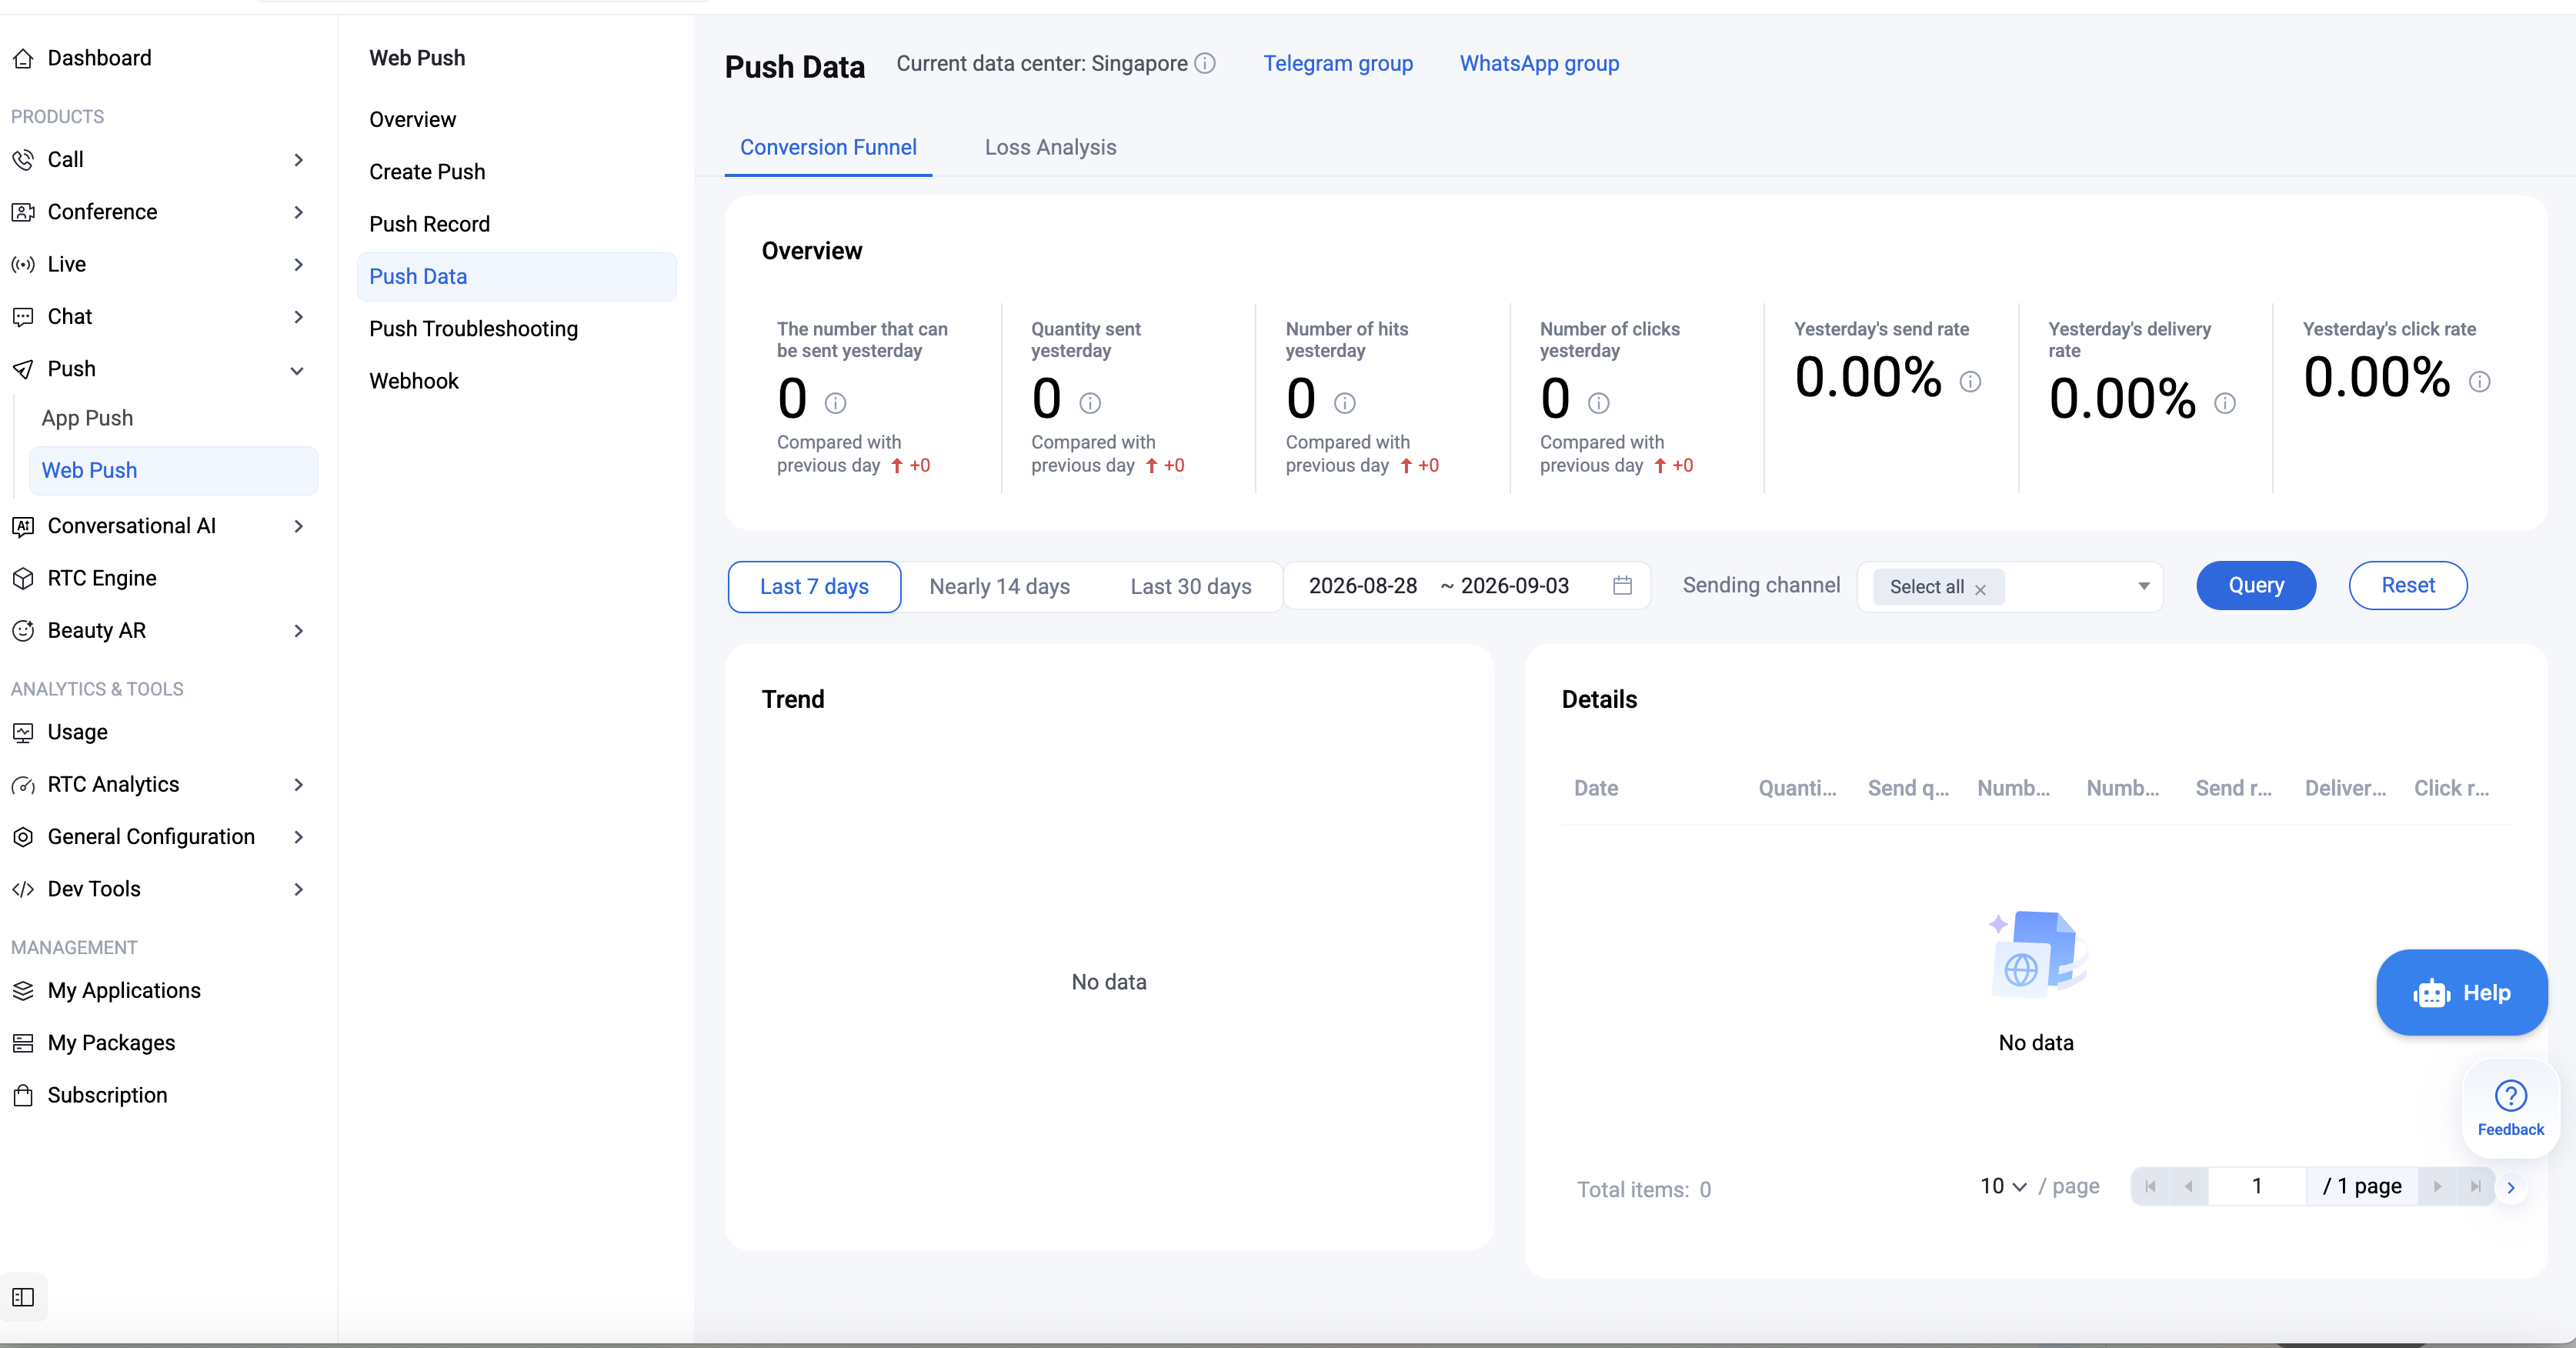
This section provides statistical insights into various push metrics for your application over recent days. You'll find a summary of yesterday's push results, conversion funnels across multiple time intervals, browser-based segmentation, and detailed daily push metric records.
Conversion Funnel
Yesterday’s Push Metrics Overview
Metrics include: Sendable Count, Sent Count, Delivered Count, Click Count, Actual Send Rate, Delivery Rate, Click Rate.
Query Conditions
Time Window: Supports last 7 days, last 14 days, last 30 days, and custom time windows. Required.
Send Channel: Allows segmentation by browser.
Query Results
Data Trends
Displays sendable count, sent count, delivered count, displayed count, and click count for all pushes within the selected time interval.
Data Details
Includes send date, sendable count, sent count, delivered count, click count, actual send rate, delivery rate, and click rate for each push record.
Metric Calculation Methods
Sendable Count: The total number of valid devices eligible to receive the push, filtered from the target audience selected for the push task.
Sent Count: The number of valid devices among the sendable devices that have successfully received the push via online or browser channels.
Delivered Count: The number of devices that have successfully received the push notification via online or browser channels.
Click Count: The number of pushes that were successfully displayed and clicked.
Actual Send Rate: Sent Count / Sendable Count × 100%.
Delivery Rate: Delivered Count / Sent Count × 100%.
Click Rate: Click Count / Delivered Count × 100%.
Attrition Analysis
Analyze causes of attrition based on conversion funnel data.
Query Conditions
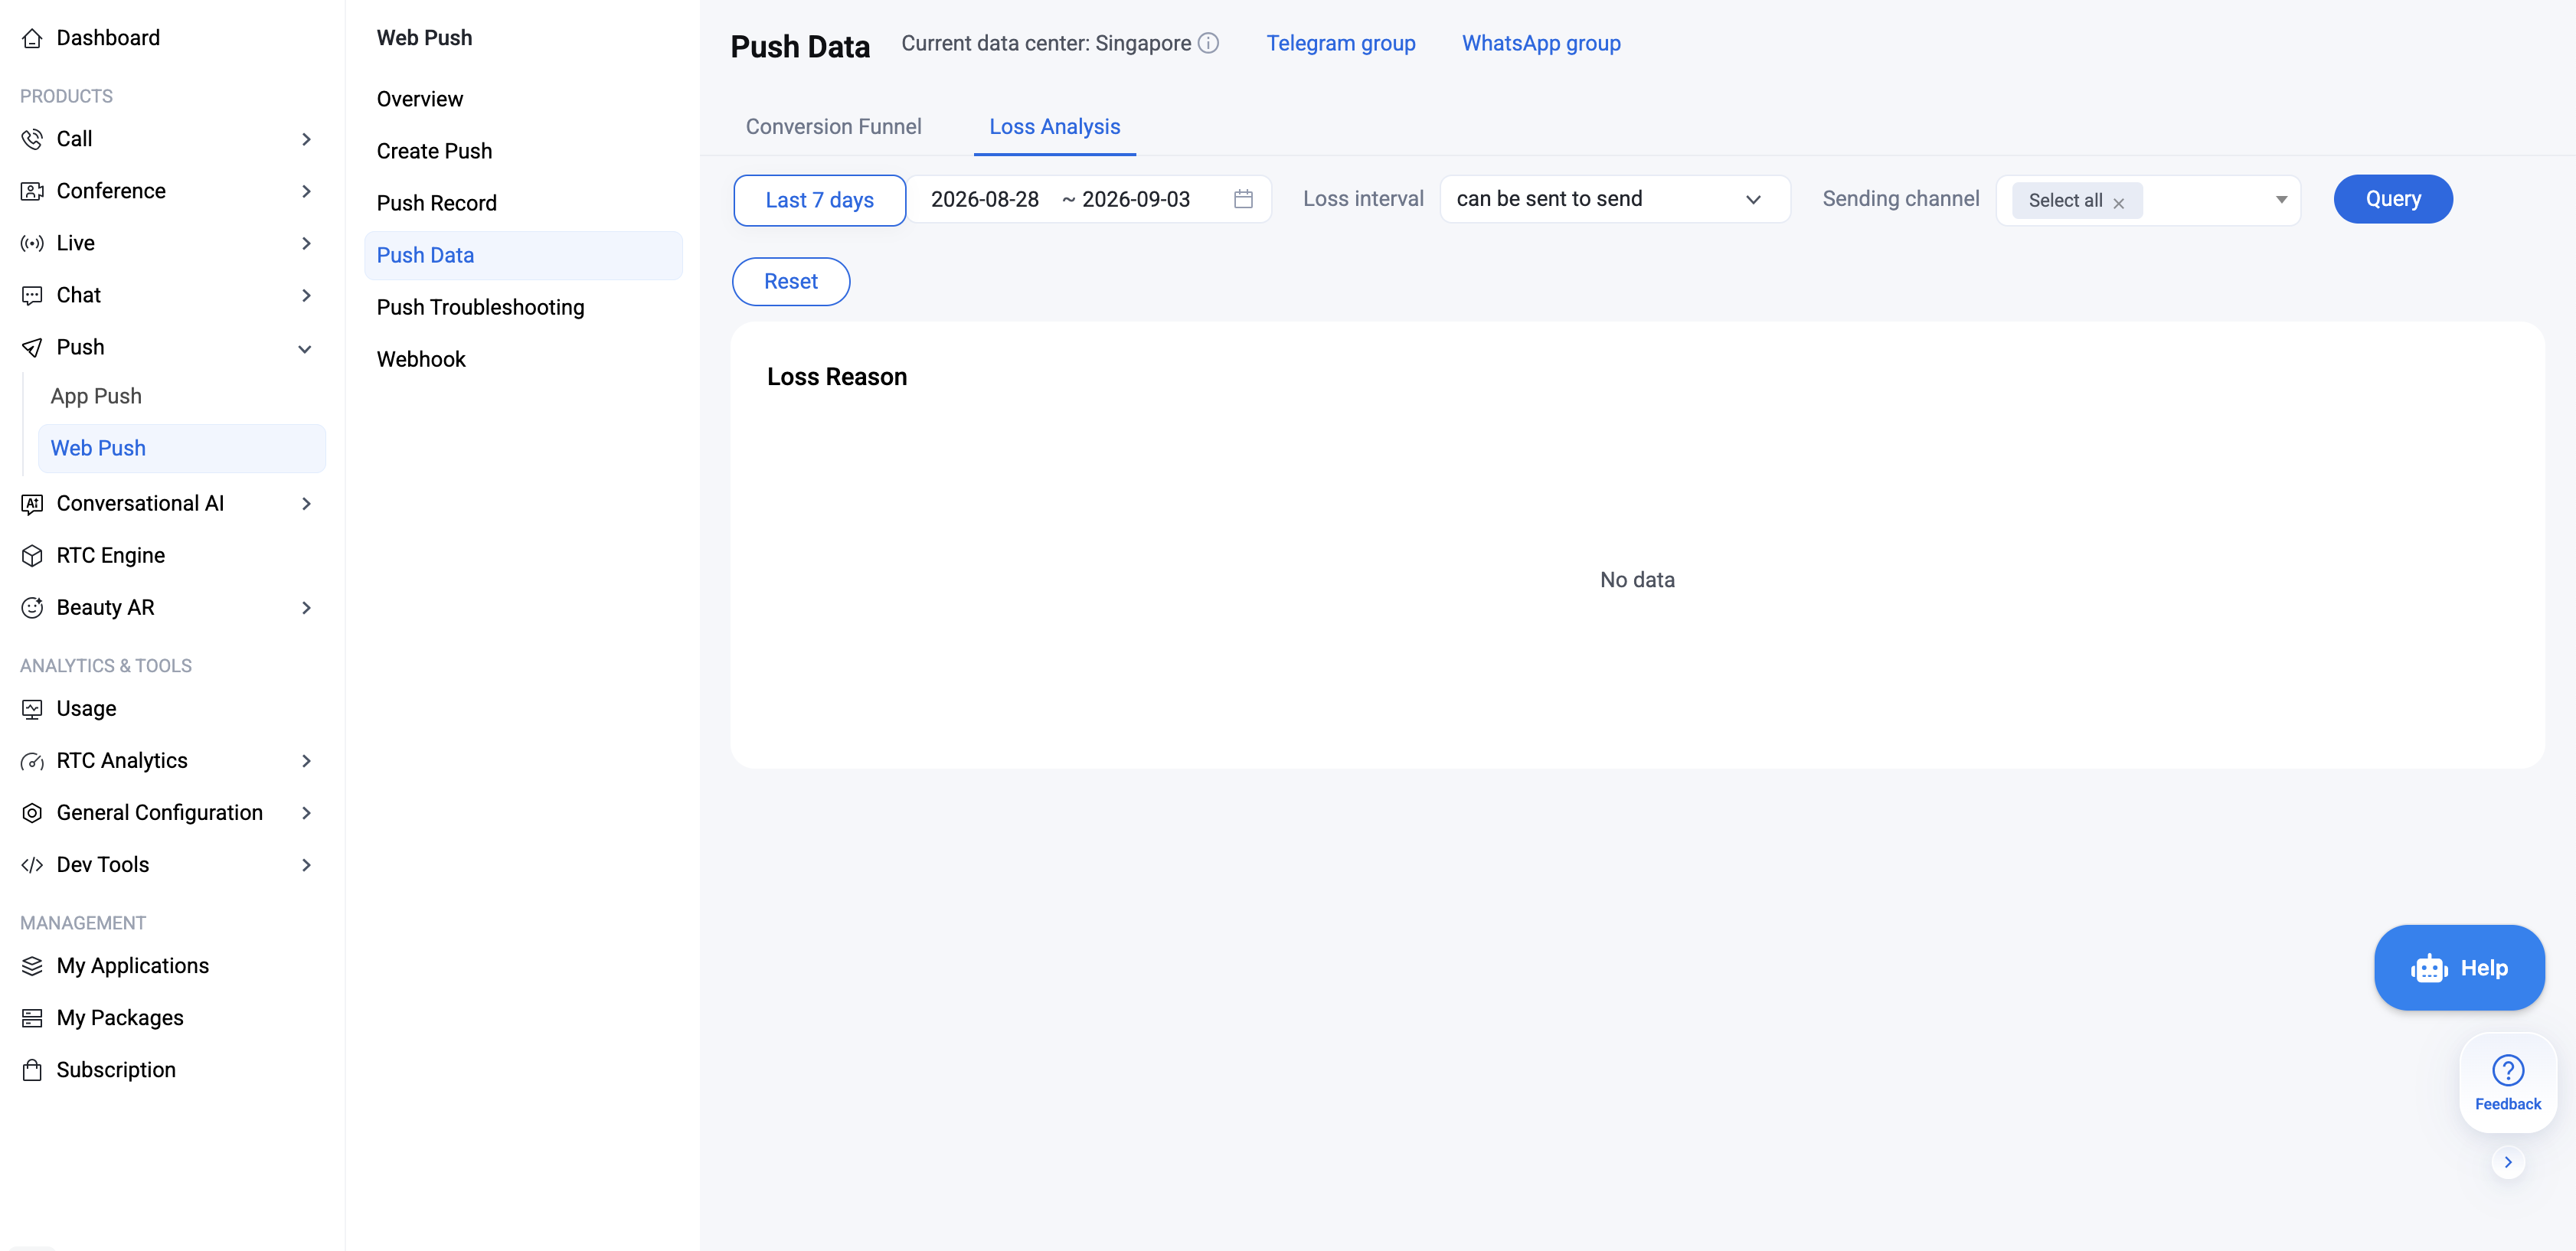
Time Window: A specified period within a given date, up to 7 days. Required.
Attrition Interval: Supports viewing attrition from Sendable to Sent, and from Sent to Delivered.
Send Channel: Allows segmentation by browser.
Query Results
Displays attrition causes and their respective proportions.
Term | Description |
Sendable Count | The total number of valid devices eligible to receive the push, filtered from the target audience selected for the push task. |
Sent Count | The number of valid devices among the sendable devices that have successfully received the push via online or browser channels. |
Delivered Count | The number of devices that have successfully received the push notification via online or browser channels. |
Click Count | The number of pushes that were successfully displayed and clicked. |
Actual Send Rate | Sent Count / Sendable Count × 100%. |
Delivery Rate | Delivered Count / Sent Count × 100%. |
Click Rate | Click Count / Delivered Count × 100%. |